The short version
Lukra limits intake with a single physical constraint: the satiety units a cow eats cannot exceed her feed intake capacity. Every feed gets a satiety value calculated from its own composition, and the cow gets a capacity from her parity, days in milk and days pregnant. Substitution — how much pasture a kilo of palm kernel displaces — is an output of that arithmetic rather than a number somebody types in. Zom’s model has no body-weight term, so we added one: a single herd-level scalar from mature cow weight, sourced to a published coefficient and cross-checked against an independent breed factor from Danish work.
Why this is hard to get right
Most published intake models predict what a cow will eat from what she is producing. Milk yield is the strongest single predictor there is, so almost every model uses it.
That works beautifully in a spreadsheet and not at all inside an optimiser. Lukra decides how much milk the herd should produce — it is the answer, not the question. A model that needs milk yield as an input to predict intake, when intake is what determines milk yield, is a circle. You can iterate your way around it, but then the intake ceiling depends on the solution you are still looking for, and the whole thing stops being a linear program.
So the model we needed had to predict capacity from the cow herself, with nothing borrowed from the answer.
The fill-unit idea
Zom et al. (2012) is a fill-unit system, and the arithmetic is almost disappointingly simple:
intake (kg DM/day) = feed intake capacity ÷ the satiety value of the diet
The cow is described by a feed intake capacity (FIC) — how many “satiety units” she can process in a day. Each feed is described by a satiety value (SV) — how many of those units a kilogram of its dry matter contains. Grass silage of average composition is defined as 1.0, so everything else is relative to it.
Inside Lukra that becomes one constraint per animal group per month:
Σ (kg DM of each feed × its satiety value) ≤ the cow’s capacity that month
Three things about that arrangement made it the right choice.
Satiety values come from composition. The SV of a forage is calculated from its dry matter, crude protein, crude fibre and digestible organic matter, using a different equation for each feed class — grass silage, fresh grass, maize silage, legume silage, whole-crop cereal, concentrate. No feeding trial is required to place a new feed in the system, which matters when a New Zealand farm’s ingredient list includes things a Dutch trial never saw.
Capacity comes from the cow, not her output. FIC is predicted from parity, days in milk and days pregnant. It rises steeply after calving, plateaus, and is pulled down by advancing pregnancy. Nothing in it needs to know how much milk she is making, which is exactly what makes it usable as a constraint.
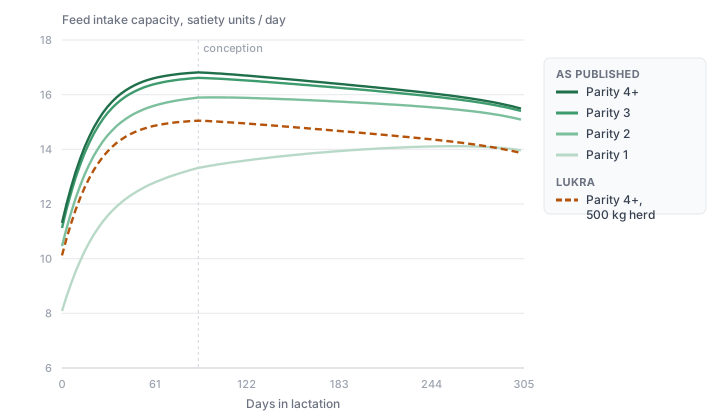
Capacity in satiety units per day, from Zom’s Equation 9 with the INRA dry-cow factor, conception at day 90. The dashed line is the same mature-cow curve after the 500 kg size correction described below — it lands just under the published parity 2 curve, which is a fair summary of the whole correction: a mature New Zealand crossbred has about the rumen capacity of a Dutch second-lactation cow.
Note the first-parity line. It is still climbing at the end of lactation, where the older cows have long since peaked — Zom’s own published finding, not an artefact. A heifer’s tightest month for rumen space is the one just after she calves, which is also when her energy demand is rising fastest.
Substitution stops being an input. This is the part we value most. Other systems need a substitution rate — how much forage a kilo of concentrate displaces — supplied as a parameter, and it is a notoriously slippery number. In a fill-unit system it is simply the ratio of two satiety values. Feed a kilo of palm kernel at SV 0.33 into a pasture ration at SV 0.87 and it frees up 0.33 units of rumen space, which buys back 0.38 kg of pasture. The substitution rate is 0.38. The choice of pasture as a reference feed here is more or less arbitrary.
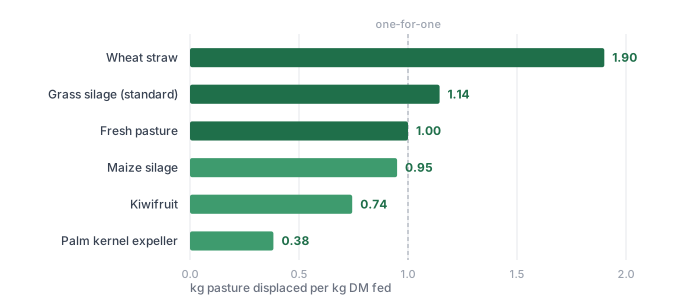
Every bar is one satiety value divided by another. Straw is expensive in rumen space and cheap in dollars; palm kernel is the reverse. Nothing here was measured in a substitution trial or entered as a parameter — it falls out of the composition of each feed. Pasture is shown at a satiety value of 0.87; see the caveat below on how firm that figure currently is.
Go deeper: why the coefficients have to be diet-independent
The Nordic (NorFor) and French (INRA) fill-unit systems both include body weight, which is the thing we had to add to Zom by hand. We looked hard at both and could not use either.
In those systems a feed’s fill value is not a fixed property of the feed. It is adjusted for the proportion of concentrate in the ration, and in NorFor also for the ration’s mean forage fill and the cow’s own capacity. That is biologically richer — substitution genuinely does rise as concentrate goes up — but it means the constraint coefficient depends on the ration, and the ration is what the solver is choosing. Inside a linear program that is not a drop-in; it is a fixed-point iteration.
Zom tested a concentrate-level term explicitly and found it non-significant, so his satiety values are properties of the feed alone. That single decision is what makes the constraint linear, and it is why we accepted a missing body-weight term rather than a solution-dependent coefficient.
The thing Zom leaves out
Zom deliberately excludes body weight, and argues the case at some length: within a lactation, weight and intake move in opposite directions — a fresh cow is losing condition while her intake climbs — so body weight is a poor predictor. He uses age instead, calculated from parity and days in milk.
Within a herd, that is sound. Across herds it leaves a gap. The model was calibrated on Dutch Holsteins averaging 593 kg. A 450 kg New Zealand crossbred gets handed the capacity of a cow a third heavier than she is, and nothing in the equations knows the difference.
Zom says as much himself: applied outside high-merit Holstein-Friesians, FIC should be adjusted for breed or genetic potential. He does not supply the adjustment.
How we corrected it
We took the coefficient from de Souza et al. (2019) — the intake equation adopted as Equation 2-1 in NASEM (2021), fitted on 31,635 weekly observations from 2,791 cows. Among its terms is 0.022 kg of dry matter intake per kg of body weight, holding milk energy, body condition, parity and stage of lactation constant. That is a size effect cleanly separated from production, which is precisely what was needed.
We apply it as a ratio rather than a level:
scalar = (A + 0.022 × mature weight) ÷ (A + 0.022 × 593.41)
where A collects the rest of the de Souza equation — milk energy, body condition score, parity and stage of lactation — evaluated once for the herd’s mature cow. Those terms do not disappear; they sit inside A and set the level against which the body-weight term is weighed. Using a ratio matters: de Souza’s dataset pools thousands of rations, so there is no single diet behind it and no way to convert its absolute prediction into fill units. As a ratio, the unknown diet cancels — and so does the lactation-stage term, which is why one number serves the whole herd for the whole year.
For a 500 kg New Zealand herd that scalar is 0.895. Capacity is reduced by about a tenth against a Dutch cow.
Does it agree with anything?
A correction we derived ourselves is only worth having if something independent points the same way. Danish work by Kristensen and Søndergaard (1998) put Jersey intake at 0.83 of the large breeds — a breed factor, arrived at empirically, and used in exactly this role by Jensen et al. (2015) when they ran the Zom model on Scandinavian data.
Running our scalar over the plausible Jersey mature-weight range:
| Jersey mature weight | our scalar |
|---|---|
| 400 kg | 0.77 |
| 420 kg | 0.80 |
| 450 kg | 0.83 |
Lukra’s Jersey defaults — 5.7% fat, 4.1% protein, 4.9% lactose — at a 4,500 kg genotype. Varying the genotype from 4,000 to 5,000 moves each figure by about one point, so the comparison does not hinge on that assumption.
The published breed factor sits inside that range, and we reach it from an entirely different direction — a body-weight coefficient fitted on American Holsteins, versus a Danish breed comparison. Two unrelated routes landing within a few percent of each other is about as much reassurance as this kind of correction ever gets.
What we took out
Lukra’s cow model descends from an earlier Delphi prototype — a working proof of the approach rather than a production system — and part of this work was going back through what it was actually doing.
Three multipliers were being applied on top of Zom’s published equation: a genotype correction, a scaling by each period’s live weight, and a dry-cow factor. None was in the paper. Two had no recorded source at all, and between them they were cutting feed intake capacity by about 31% — enough to put a first-lactation cow’s predicted intake at 10.7 kg DM/day when the published equation gives 14.8.
The six model parameters themselves had also drifted from the published values. Correcting them changed the answer by less than a percent — but the point of using a published model is that the numbers are the published ones, and the satiety values and the capacity equation have to come from the same calibration or the pairing between them means nothing.
What we kept was the dry-cow adjustment, which comes from INRA practice and does real work: Zom’s final equation has no declining phase, so without it a dry cow carries nearly a peak-lactation intake capacity. What replaced the other two is the single mature-weight scalar described above — computed once from herd mature weight rather than per month from a growing animal’s live weight, which was double-counting the age term Zom uses to carry size in the first place.
How we check it
Ronald Zom shared a worked implementation of his model with us directly. Lukra’s test suite reproduces all forty rows of its capacity table — four parities across the lactation — to the last decimal place, along with each intermediate factor separately, so a future failure says which term moved rather than only that something did.
The pairing gets its own test. Feed intake capacity divided by pasture’s satiety value has to land at a realistic daily intake for a New Zealand cow; if it does not, the two halves of the model are not from the same calibration. It comes out at 17.6 kg DM/day averaged across lactation for a mature cow and 14.9 for a heifer.
What we know is still soft
The model is not the most accurate one available. Jensen et al. (2015) evaluated five intake models against Scandinavian data and Zom came last, with a root mean square prediction error of 3.2 kg DM/day against 1.2 for the best performer.
Two things temper that. The authors interpolated crude fibre values for the trial feeds from database tables rather than measuring them — and their own sensitivity analysis found that raising crude fibre by 10% moved the error from 3.2 to 3.0 kg, which says the inputs were carrying some of the blame. We have found the same sensitivity: forage satiety values move noticeably with crude fibre, which is why we treat it as a value worth sourcing properly rather than estimating.
More to the point for our purposes, Zom was the model that improved most when the analysis looked at differences between diets within an experiment rather than absolute levels across experiments. A ration optimiser is asking exactly that question — not “what will this cow eat”, but “how does this feed change what she can eat” — and that is the comparison Zom’s structure is built for.
Our pasture crude fibre is provisional. The satiety value we currently use for young pasture rests on a hand-entered figure while the sourced value is loaded properly. Every substitution rate in this post inherits that.
On a well-fed pasture herd, the constraint rarely binds. In our test runs the fill ceiling sat 26–50% above where the optimal solution landed — the binding limits were pasture growth and the economics of the marginal cost of increased milk production, not rumen capacity. That is the right answer, and worth saying plainly: this constraint earns its keep in the harder cases. Force six kilos of straw into the ration and it binds in eleven months of twelve.
References
Zom, R.L.G., André, G., van Vuuren, A.M. (2012). Development of a model for the prediction of feed intake by dairy cows: 1. Prediction of feed intake. Livestock Science 143: 43–57. — the capacity equation and the satiety value equations Lukra implements.
Zom, R.L.G., André, G., van Vuuren, A.M. (2012). …2. Evaluation of prediction accuracy. Livestock Science 143: 58–69.
de Souza, R.A., Tempelman, R.J., Allen, M.S., VandeHaar, M.J. (2019). Updating predictions of dry matter intake of lactating dairy cows. J. Dairy Sci. 102: 7948–7960. — the body-weight coefficient; adopted as NASEM (2021) Eq. 2-1.
Allen, M.S., Sousa, D.O., VandeHaar, M.J. (2019). Equation to predict feed intake response by lactating cows to factors related to the filling effect of rations. J. Dairy Sci. 102: 7961–7969. — the companion ration-factors paper; not used here, as it takes milk yield as an input.
Jensen, L.M., Nielsen, N.I., Nadeau, E., Markussen, B., Nørgaard, P. (2015). Evaluation of five models predicting feed intake by dairy cows fed total mixed rations. Livestock Science 176: 91–103. — independent evaluation of Zom against NRC, NorFor, TDMI and Gruber.
Zom, R.L.G. (pers. comm.). Worked implementation of the feed intake model, shared with Lukra — the reference values the capacity tests are checked against.
Kristensen, V.F., Søndergaard, E. (1998). Foderoptagelse hos jerseykøer. Grøn Viden 10, Danmarks JordbrugsForskning, Tjele. — the 0.83 Jersey breed factor used as our cross-check.
Volden, H. et al. (2011). Prediction of voluntary feed intake, in The Nordic Feed Evaluation System. Wageningen Academic. — NorFor; diet-dependent fill values.
Faverdin, P., Baratte, C., Delagarde, R., Peyraud, J.L. (2011). GrazeIn: a model of herbage intake and milk production for grazing dairy cows. Grass and Forage Science 66: 29–44.